2020 census: More singles in all age groups; slowest decade of population growth since 1970
SINGAPORE — Over the last 10 years, the proportion of singles across all age groups rose in Singapore, most prominently among those aged between 25 and 34.

Participants of a mass speed dating event in February 2016 using their mobile phones and wearing masks to help self-conscious singles step out of their comfort zone.


- The 2020 census found that the proportion of singles have risen across all age groups since 2010
- It also found that women had fewer children than in 2010
- Singapore’s population grew 1.1 per cent yearly in the last 10 years, its slowest decade of growth since 1970
- About three out of every 20 residents here were aged 65 and above in 2020
- In terms of education, residents were better-educated in 2020 than 10 years before
SINGAPORE — Over the last 10 years, the proportion of singles across all age groups rose in Singapore, most prominently among those aged between 25 and 34.
And as female residents gave birth to fewer babies, Singapore’s population grew 1.1 per cent yearly between 2010 and 2020, its slowest decade of growth since 1970, when the Government collected data for its first census after independence.
On Wednesday (June 16), the Department of Statistics released its first report on the Census of Population 2020, showing that the number of Singapore citizens grew from 3.23 million in 2010 to 3.52 million in 2020, while the permanent resident population remained stable at slightly more than 500,000.
A second report on the census data, which is collected once a decade, will be released on Friday.
The following are some of the key takeaways from the demographic data presented in the 2020 census.
MARITAL STATUS
The proportion of married residents dropped slightly to 58.8 per cent in 2020 from 59.4 per cent in 2010.
Over the same period, the proportion of those divorced or separated rose from 3.3 per cent to 4.3 per cent.
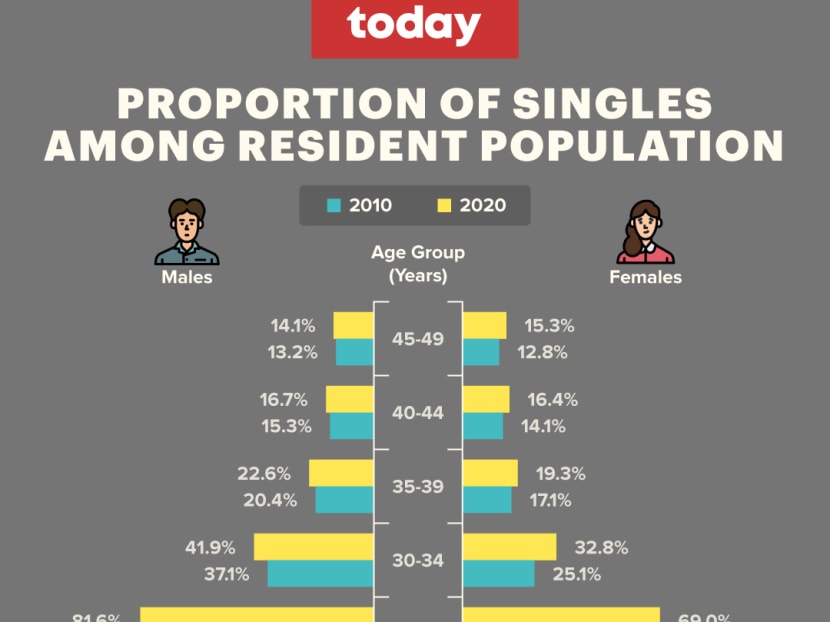
The proportion of singles, though, increased across all age groups over the past decade, especially among those aged 25 to 34.
- The proportion of singles among men aged 25 to 29 went up from 74.6 per cent to 81.6 per cent
Among women aged 25 to 29, it jumped from 54 per cent to 69 per cent
Among men aged 30 to 34, the proportion increased from 37.1 per cent to 41.9 per cent
Among women aged 30 to 34, it rose from 25.1 per cent to 32.8 per cent
The census survey found that singlehood was more common among males with lower educational qualifications and among females with higher educational qualifications.
21.1 per cent of men aged 40 to 49 who did not complete secondary school were single in 2020, compared with 12.3 per cent of men in the same age group who went to university
8.7 per cent of women aged 40 to 49 who did not complete secondary school were single in 2020, but 18.7 per cent of women in this age group who went to university were single
Still, the overall proportion of singles declined slightly from 32.2 per cent in 2010 to 31.5 per cent last year.
This is because there were lower singlehood rates among older Singaporeans, and Singapore has an ageing population.
BIRTH RATES
Data from the census showed that women residents who have been or are still married had fewer children compared with 10 years ago.
Women with two children continued to form the largest group among those 15 years old and older.
However, the proportion of women aged 30 to 39 who have two children dropped from 36.2 per cent to 33.6 per cent. For those aged 40 to 49, it fell slightly from 42.1 per cent to 41.9 per cent.
Among women aged 30 to 39 who have three children, the percentage went down from 11.2 per cent to 9.6 per cent. For those aged 40 to 49, it slipped from 22.3 per cent to 15.5 per cent.
By comparison, the proportion of women with no children or just one child increased across most age groups from 2010 to 2020.
The proportion of women aged 30 to 39 who have no children rose from 20.1 per cent to 23.8 per cent
Among women aged 40 to 49, the proportion who has no children went up from 9.3 per cent to 13.5 per cent
For women aged 30 to 39 who has one child, the proportion climbed slightly from 29.4 per cent to 29.7 per cent
The proportion of women aged 40 to 49 who has one child increased from 19 per cent to 24 per cent
Ms Indranee Rajah, Minister in the Prime Minister’s Office (PMO), said that the high costs of raising children as well as the desire to defer marriage or parenthood to focus on careers were quoted as some of the main factors for Singapore’s low birth rate — based on a series of dialogue sessions she attended.
Speaking on Monday during a briefing session with the media, Ms Indranee, who oversees the National Population and Talent division in PMO, said that work-from-home arrangements need to be looked into more deeply.
The issue with such arrangements is the blurring of lines for when work starts and ends.
“So I think the workplace, the employers, amenities factor in… and many people also want to have some time for themselves as a couple even before they raise children, so it’s a complex issue that we are looking at,” she said.
When comparing in terms of education, the average number of children born fell across all educational groups in the past decade.
Women who were more highly educated had fewer children on average.
AGEING POPULATION
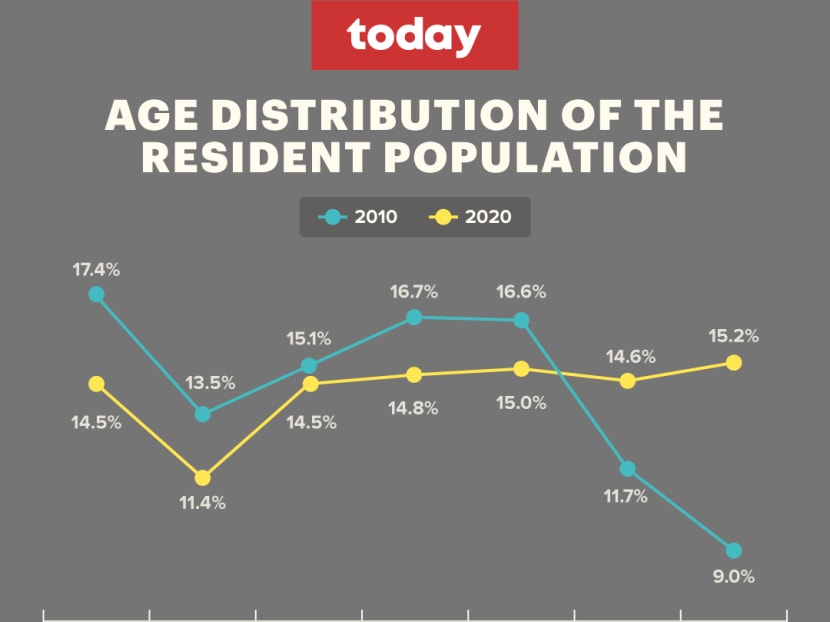
Singapore’s population continued to age with the proportion of residents who were 65 years old and above increasing from 9 per cent in 2010 to 15.2 per cent in 2020.
The proportion of those younger than 15 years old fell from 17.4 per cent to 14.5 per cent over the same period.
The median age of the resident population rose from 37.4 years to 41.5 years.
ETHNIC COMPOSITION
The ethnic composition of the resident population remained more or less the same.
In 2020, there were:
74.3 per cent Chinese
13.5 per cent Malays
9 per cent Indians
In 2010, there were:
74.1 per cent Chinese
13.4 per cent Malays
9.2 per cent Indians
EDUCATION
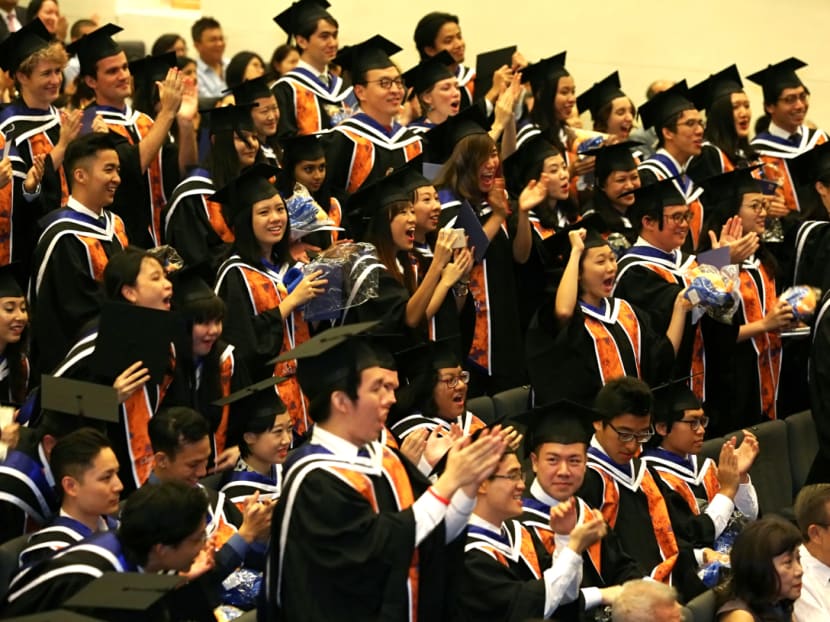
The census found that the educational profile of residents has improved over the 10 years, with 58.3 per cent of residents aged 25 and older attaining post-secondary or higher qualifications, up from 46.5 per cent in 2010.
More residents were better-educated across all age groups, with a large increase in the number of university graduates for those aged between 35 and 54.
The proportion of university graduates among those aged 35 to 44 leapt from 34.6 per cent to 52.2 per cent
For those aged 45 to 54, it jumped from 15.4 per cent to 35.5 per cent
Female residents have also become better-educated in the last 10 years.
The top three fields of study among male university graduates in 2020 were:
Business and administration (31.2 per cent)
Engineering sciences (27.2 per cent)
Information technology (11.3 per cent)
The top three fields of study among female university graduates in 2020 were:
Business and administration (39 per cent)
Humanities and social sciences (14.9 per cent)
Engineering sciences (7.4 per cent)
Business and administration was also the most popular course 10 years ago.
LANGUAGES SPOKEN
English is the language most frequently spoken at home for almost half, or 48.3 per cent, of the residents aged five and above — up from 32.3 per cent 10 years ago.
More than 86 per cent of residents also spoke a vernacular language at home besides English.
Residents across all major ethnic groups were increasingly relying on English as their main language of communication at home.
Among the Chinese community, it has taken over Mandarin to be the language most frequently spoken at home.
The survey found that 47.6 per cent of Chinese spoke English as their main language at home, while 40.2 per cent relied on Mandarin and 11.8 per cent on other Chinese dialects.
The proportion of Malays who spoke English most frequently at home increased from 17 per cent to 39 per cent.
The proportion of Indians who spoke English most frequently at home went up from 41.6 per cent to 59.2 per cent.
RELIGION
The census also found that Singaporeans were becoming less religious, with 20 per cent of residents aged 15 and above saying that they had no religious affiliation — compared with 17 per cent in 2010.
About 26 per cent of Chinese residents had no religious affiliation, much higher than Malays (0.4 per cent) and Indians (2.2 per cent).
Younger residents were also more likely to have no religious affiliation, compared with older age groups.
Last year, about 24 per cent of residents aged 15 to 24 did not have any religion, compared with 15.2 per cent of residents aged 55 and older.
Among all university graduates, 27.8 per cent did not have a religion, the biggest proportion across all educational groups.
The proportion of residents without any religious affiliation increased across most age groups and educational levels.
Even so, Singapore continues to be religiously diverse:
31.1 per cent identified themselves as Buddhists
18.9 per cent as Christians
15.6 per cent as Muslims
8.8 per cent as Taoists
5 per cent as Hindus
Between 2010 and last year, the share of Christians inched up marginally, from 18.3 per cent to 18.9 per cent, as did Muslims, from 14.7 per cent to 15.6 per cent.
The proportion of Buddhists decreased from 33.3 per cent to 31.1 per cent, and Taoists, from 10.9 per cent to 8.8 per cent.
The proportion of Hindus stayed nearly constant over the same period.
CORRECTION: In an earlier version of this article, we reported that Singapore’s population grew 1.1 per cent in the last 10 years. It actually grew 1.1 per cent yearly over that period. We also said that university graduates formed 27.8 per cent, or the biggest share, of residents who did not have a religion. This was incorrect. Among all university graduates, 27.8 per cent did not have a religion, the biggest share across all educational groups. We reported that the proportion of residents without any religious affiliation increased across all age groups and educational levels. This was incorrect. It increased across most age groups and educational levels, as the share of residents with post-secondary (non-tertiary) qualifications who had no religion decreased between 2010 and 2020. We are sorry for the errors.
Related topics
census population singles ageing Education birth rateStay in the know. Anytime. Anywhere.

Subscribe to our newsletter for the top features, insights and must reads delivered straight to your inbox.
By clicking subscribe, I agree for my personal data to be used to send me TODAY newsletters, promotional offers and for research and analysis.