Explainer: What is the weekly infection growth rate and how does it help us assess the Covid-19 situation?
SINGAPORE — Finance Minister Lawrence Wong talked about a new "key indicator" called the weekly infection growth rate that could be used to assess Singapore’s Covid-19 situation, along with other considerations.

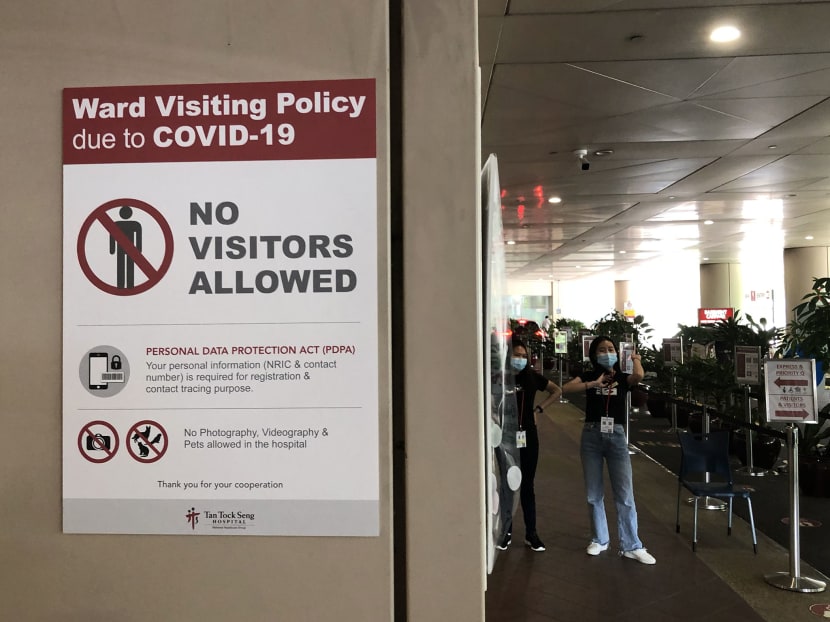
Hospitals in Singapore are not allowing visitors until Nov 24, 2021, as part of public health safety measures against Covid-19.
- Covid-19 task force co-chair Lawrence Wong recently mentioned a “key indicator” called the weekly infection rate
- This is the ratio between the number of cases in one week and the number in the previous week
- The ratio is now about 1.11, which means the number of cases is increasing week on week
- One expert said the ratio included only reported cases and another said the healthcare system may be strained even if the rate falls below 1.0
- The number of ICU beds occupied will not suddenly drop even if community cases fall, as there is a lag factor, one expert said
SINGAPORE — Finance Minister Lawrence Wong talked about a new "key indicator" called the weekly infection growth rate that could be used to assess Singapore’s Covid-19 situation, along with other considerations.
Mr Wong, a co-chair of the governmental Covid-19 task force, said during a media briefing on Saturday (Oct 23) that household members dining together in groups of five, team sports and school activities could be allowed if this key indicator slows, and other criteria are met.
He said that if this ratio drops below 1.0, and the situation at hospitals and intensive care units (ICUs) remains stable, the task force will consider some “calibrated” easing of measures.
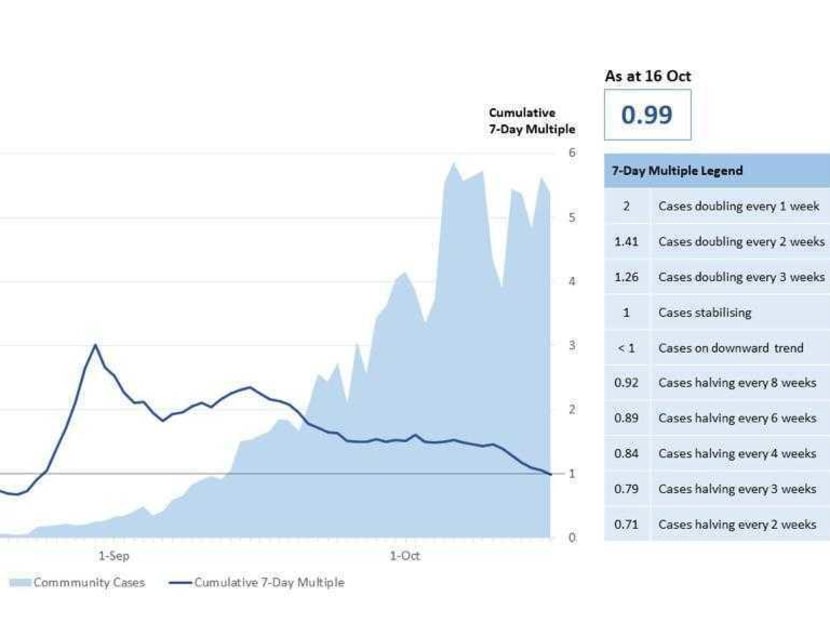
The rate, which is the ratio of community cases in the past week over the week before, is now slightly above 1.0.
A ratio of above 1.0 means that infections are continuing to rise and putting pressure on the healthcare system.
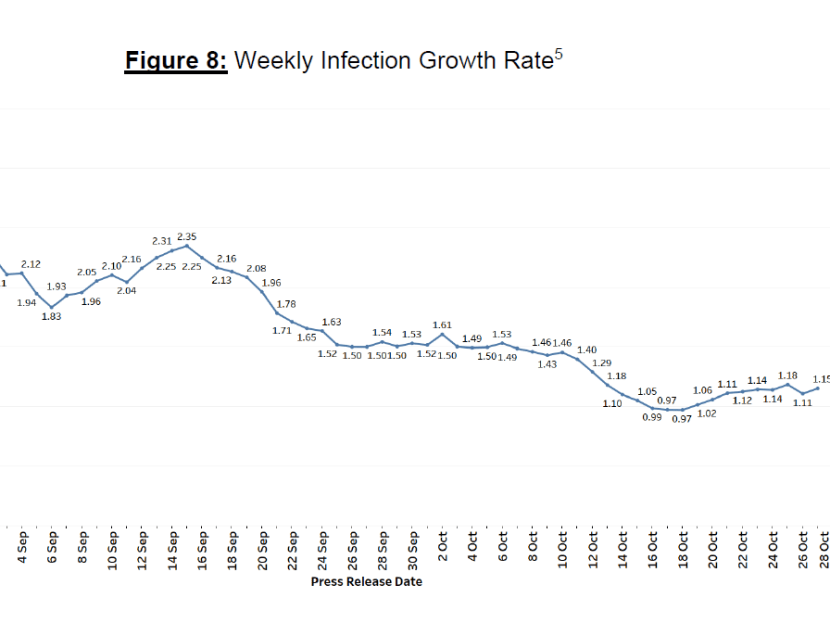
The Ministry of Health (MOH) has also included a chart showing how the weekly infection rate is trending since last Saturday.
It reached a peak of 3.01 on Aug 30, which means that the number of cases that day was three times more than the number of cases on Aug 23. The rate was 1.15 as of Wednesday.
Another new chart shows the daily usage of ICU beds.
Madam Ho Ching, Prime Minister Lee Hsien Loong’s wife, also touched on the issue of the weekly infection growth rate in a Facebook post last Friday.
With a week-on-week multiple of daily new cases at between 1.11 and 1.14, there will be a doubling of cases every six to seven weeks, she said.
Mdm Ho added that Singapore residents should not expect dining restrictions to be lifted soon, given that it was the previous relaxation of dining rules that was the driver for the current infection wave.

Before the stabilisation phase started in late September, a maximum of five vaccinated people could dine anywhere, while a maximum of two persons regardless of their vaccination status could eat at hawker centres and coffee shops.
Mdm Ho wrote in her Facebook post: “All of us are better off spending our energies to increase the vaccination rates. That is the real solution, instead of crying for more people to dine in when our hospitals are under tremendous pressure already.”
TODAY explains what this new indicator means and why it is important.
WHAT IS THE WEEKLY INFECTION GROWTH RATE
Simply put, the number is a week-on-week change in diagnosed case numbers, Associate Professor Alex Cook said. He is the vice-dean of research from the Saw Swee Hock School of Public Health at the National University of Singapore (NUS).
For example, if there were 100 cases one week and 100 cases the next week, the ratio would be 1.0.
If there were 100 cases one week and 110 cases the next week, the ratio would be 1.1. If there were 100 cases one week and 90 cases the next week, it would be 0.9.
Assoc Prof Cook said that this figure is not the same as the reproduction rate, denoted as R, which refers to the average number of people to whom one infected person will pass the coronavirus.
Dr Asok Kurup from Mount Elizabeth Hospital said, though, that the weekly infection growth rate could be seen as a spinoff of the reproduction rate.
Both indicators measure the speed of growth of the epidemic.
Assoc Prof Cook said that the weekly infection growth rate is a more straightforward and transparent number to report, given that there are multiple ways to calculate the R value and they are not completely consistent.
The benefit of weekly ratios is that it takes away the “day-of-the-week” effect, the experts said.
“Usually, there’s a spike on Tuesdays, which is mostly due to the results coming in for people who waited until Monday, the day before, to go to a clinic (after the weekend). This kind of pattern is quite common, we see it with influenza, for example, and can be overcome by taking the ratio of today to one week ago,” Assoc Prof Cook said.

HOW TO ASSESS WHETHER THE SITUATION IS STABILISING
Given that the weekly infection growth rate fluctuates day by day, Dr Asok said that the indicator has to be monitored over a period of time for a more accurate reflection of the Covid-19 situation in Singapore.
For example, a public holiday falling in one week could inflate the number of community transmission cases, while the following week without a holiday would revert to the more usual pattern. This could mean the indicator falls below 1.0 and gives the impression that “things are looking dandy”.
“You’ve to give it time to correct itself.”
He believes that a rate below 1.0 stretching over 10 to 14 days could be a sign that things are stabilising.
However, Assoc Prof Cook said that this would take into account only diagnosed cases.
“Case ascertainment is probably falling, too, as we scale back on contact tracing and the strictness of isolation and quarantine, so it’s important not to get too excited if the ratio falls below 1.0, unless the number of severe cases is also falling,” he said.
“We should similarly not use the weekly ratio falling below 1.0 as an indicator that we can start relaxing measures and instead, should be looking at a broader set of metrics, in particular the healthcare utilisation due to Covid-19.”
Dr Ling Li Min, an infectious diseases physician at Rophi Clinic, said that the strain on the healthcare system could still remain even if the rate goes down, if many infected cases are among unvaccinated people who are old or have underlying medical conditions.
WHAT ICU BED OCCUPANCY SHOWS
Dr Asok said that the number of people occupying ICU beds will not suddenly drop even if community cases drop.
This is because the condition of infected Covid-19 patients may worsen at the seventh- to 10th-day mark and so, there will be a lag for ICU figures.
“One cycle is approximately two weeks. But I think it can take up to a month to slow down and to see numbers whittle down,” he said.
In principle, Dr Asok believes that an ICU utilisation rate of between 50 per cent to 66.6 per cent is a bad signal.
However, if the numbers are going up slightly in the midst of declining community cases, that may not be such a worrying sign, he said.
A utilisation rate of less than half and trending downwards over a month would be an indication of things stabilising.
As of Wednesday, the ICU utilisation rate was 79.8 per cent.


