Hardest hit by pandemic, bottom 10% of households see earnings shrink 6.1% in 2020
SINGAPORE — Households in the bottom 10 per cent saw their average monthly income per member shrink by S$37 last year, or 6.1 per cent of their total earnings from work, making them the group hit hardest by the Covid-19 pandemic.

The economic impact from the pandemic caused median monthly household income from work to drop by 2.4 per cent last year after adjusting for inflation — the first drop in more than 10 years.


- Median monthly household incomes from work dropped for the first time in more than 10 years in 2020 due to the pandemic
- The bottom 10 per cent of households were hit hardest, with average monthly household income shrinking 6.1 per cent
- Those in the top 10 per cent saw their incomes fall 2.3 per cent
- The Gini coefficient, which measures inequality, dropped to its lowest since 2000, after accounting for government taxes, transfers
SINGAPORE — Households in the bottom 10 per cent saw their average monthly income per member shrink by S$37 last year, or 6.1 per cent of their total earnings from work, making them the group hit hardest by the Covid-19 pandemic.
At the other end of the spectrum, those in the top 10 per cent income group earned S$337 less each month last year, or 2.3 per cent of their earnings from work, the Department of Statistics said on Monday (Feb 8) in its yearly Key Household Income Trends report.
On the whole, the median monthly household income for resident employed households — those comprising citizens and permanent residents with at least one person in the workforce — declined by 2.5 per cent in nominal terms (unadjusted for inflation). It fell from S$9,425 in 2019 to S$9,189 last year, when the economy was hobbled by the pandemic.
After adjusting for inflation, median household incomes fell by 2.4 per cent in real terms last year, the first drop in more than 10 years. The last decline, which was also 2.4 per cent, happened in 2009 after the Global Financial Crisis from 2007 to 2008.
Against the backdrop of the pandemic, Singapore’s Gini coefficient — a measure of income inequality — fell to its lowest since 2000, as the Government distributed more help to those living in smaller Housing and Development Board (HDB) flats.
Here are the key trends:
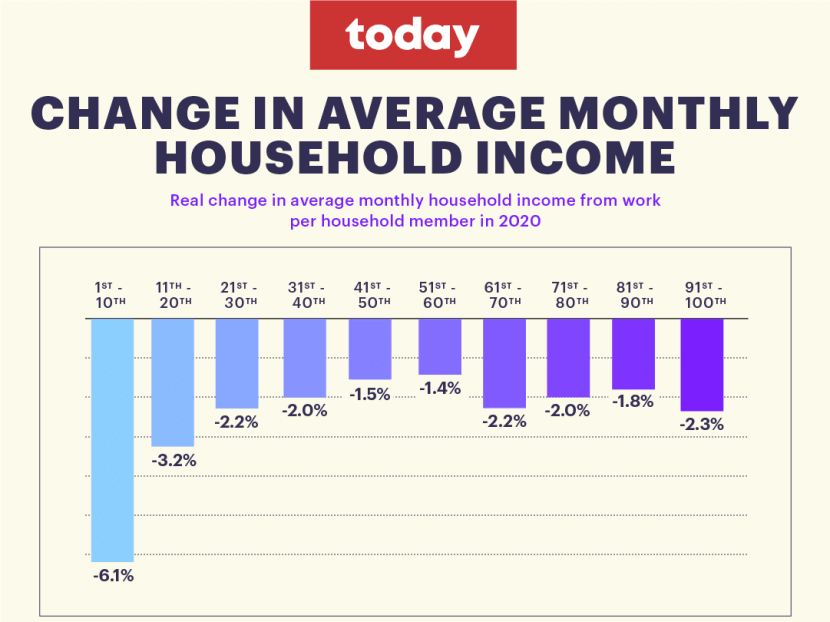
DROP IN AVERAGE MONTHLY HOUSEHOLD INCOMES
Last year, all income groups experienced a drop in real average monthly household incomes per household member owing to the pandemic.
The bottom 10 per cent saw the biggest drop of 6.1 per cent between 2019 and last year. This translates to a S$37 decline per member
Those who faced the gentlest effects were in the 51st to 60th percentile income bracket. Their average monthly household income per member fell 1.4 per cent, or a drop of S$49
The group in the top 10 per cent experienced a 2.3 per cent decline, meaning that each household member took home S$337 less each month last year
DROP IN MEDIAN MONTHLY INCOMES
The median monthly household income per household member fell from S$2,925 in 2019 to S$2,886 last year. This translates to a 1.3 per cent drop in nominal terms or 1.2 per cent in real terms
This is the first decline since 2009, when it dropped to S$1,735 from S$1,754 the year before
RISE IN MEDIAN, AVERAGE MONTHLY HOUSEHOLD INCOMES OVER LAST 5 YEARS
Despite the declines, median monthly household incomes and the average household income from work per household member rose over the last five years.
Between 2015 and last year, the median household income per household member rose by 14.6 per cent cumulatively, or 2.8 per cent yearly after adjusting for inflation
Over the same period, households across all income groups saw their average income per household member rise in real terms from 0.6 per cent to 2.9 per cent yearly
The largest rise in average monthly household income per member was for those in the 71st to 80th percentile, whose incomes rose by 2.9 per cent
The top 10 per cent and bottom 10 per cent of households saw the smallest increases of less than 1 per cent over the last five years
GOVT TRANSFERS LARGEST FOR THOSE IN SMALLER FLATS
Meanwhile, households received significantly more government transfers last year. This was especially so for those living in smaller HDB flats.
The help rolled out last year included the Covid-19 Support Grant to assist those who lost their jobs or suffered a loss of income during the pandemic.
Overall, households received S$6,308 in government transfers per household member last year, up from S$4,684 in 2019
Those living in one-room and two-room HDB flats received S$13,670 last year — the highest across all housing types. This group of households received S$10,680 in government transfers in 2019, also the highest across all housing types that year
Households living in condominiums and other apartments received S$3,741 in government transfers last year, the lowest among all housing types
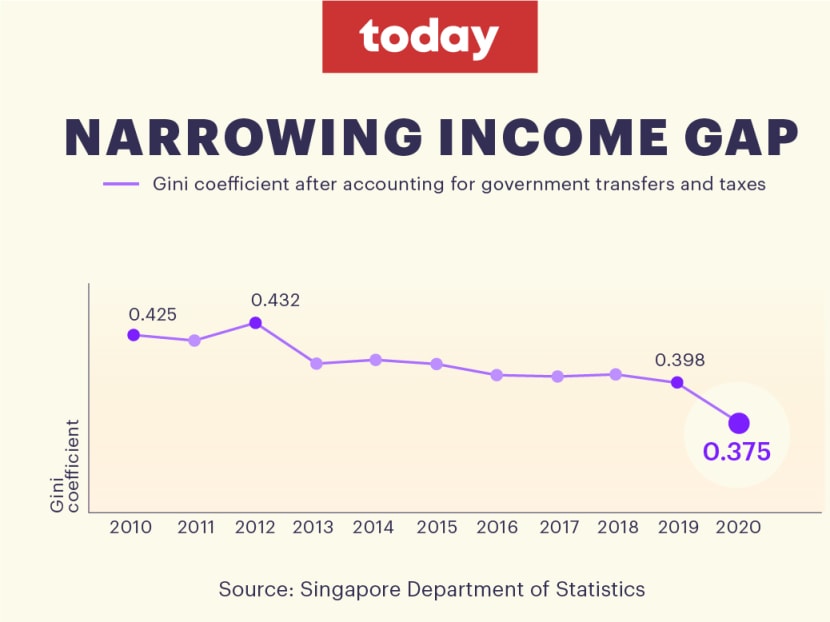
NARROWING INCOME GAP
After accounting for government transfers and taxes, Singapore’s Gini coefficient was at its lowest last year since 2000, when such data was first collected — a sign of narrower income inequality in Singapore.
The Gini coefficient measures income inequality on a scale of zero to one. The higher the number, the greater the degree of income inequality, with zero being equal.
The Gini coefficient last year, after government transfers and taxes, was 0.375, lower than 0.398 in 2019
This is the second consecutive drop since 2019, when it fell to 0.398 from 0.403 the year before
It is the lowest since 2000, when it came in at 0.414
The Gini coefficient, before accounting for government transfers and taxes, stood at 0.452 last year — the same as the year before
CORRECTION: In an earlier version of this story, we reported that the Gini coefficient was 0.452 in 2018, after accounting for government transfers and taxes. This was incorrect. The Gini coefficient for 2018, after government transfers and taxes, is 0.403. We are sorry for the error.
Related topics
low-income households Covid-19 incomeStay in the know. Anytime. Anywhere.

Subscribe to our newsletter for the top features, insights and must reads delivered straight to your inbox.
By clicking subscribe, I agree for my personal data to be used to send me TODAY newsletters, promotional offers and for research and analysis.